MENU
Recreation Trails of the Allegheny National Recreation River
Oil Heritage Region of Pennsylvania
Oil Heritage Region of Pennsylvania
A trail utilization study was conducted in the Oil Heritage Region of Venango County and the southern portion of Crawford County in Pennsylvania from July 2006 to December of 2006. A network of trails over 60 miles in length that spans through Oil Creek State Park, Two Mile Run County Park, and traverses along the Allegheny River was the study area of the project. The following greenway trail systems were monitored in the study: the Allegheny River Trail, the Justus Trail, Two Mile Run County Park, the Sandy Creek Trail, the State Forest at Kennerdell, and Oil Creek State Park. The waterway trail system was also analyzed on a limited basis in the study (See Appendix A: Project Location Map).
The study discloses the volume of trail use, the residency of trail users and distance that these users arc traveling to access the trails, the size of groups visiting the area, the favored types of recreational activities, the seasonality of trail use, the types of accommodations most often used, the types of expenditures that trail users perform, and the recreational attributes that users consider to be important and what types of conditions these attributes are in within the area.
Based on the trail counters that operated from July of 2006 to October of 2006, a total of 82,930 users were estimated to be visiting the trails in the Oil Heritage Region. According to the 261 surveys that were returned during the total study period, these trail users are predominantly from Pennsylvania (78%), especially the western portion of the state. Only 23% of in-state users arc categorized as living within the Oil Heritage Region. Twenty-two percent (22%) of trail users travel from other states such as Ohio, New York, and Florida to visit the trails. Trail users most often access the trails with another person, and travel, on average, a distance of 33.25 miles to get to the trails. Trail users are mostly employed professionals or retired and tend to he middleaged, falling into the age cohort of 46 to 65 years old.
Seventy-five percent (75%) of surveyed trail users cited the trails as their main reason for coming to the area. They often enjoy an above average income. Trail users often visit die trails to go biking (74"0) and walking (16.6%). Almost four percent (3.8%) of trail users back pack and jog the trails. Most trail users come to the trail system within the Oil Heritage Region to enjoy the scenery, watch wildlife, and go birding. The majority of trail users visit the trails a few times per year and stay on the trails for at least two hours, while they are there. Seventy-seven percent (77%) of the users are day-trip users who prefer to visit in the autumn and summer season. The users who do stay overnight, tend to stay for two nights and often stay in campgrounds. Trail users find the natural scenery, cleanliness, smooth trail surfaces, and maintenance of the trails to be the most important recreational aspects of the trail, while they hold cleanliness, connection to picnic areas, shade, and parking as the most highly regarded attributes Of the trail system within the Oil Heritage Region.
Non-local trail users spent an average of $32.93 per person per day or $538.49 per group, while Oil Heritage users spent a daily average of $3.71 per person or $10.91 per group. Trail users spent the majority of their money on dining out and lodging. The 82,930 users who visited the trails between July and October created an economic benefit of $2.22 million within the Oil Heritage Region. It is estimated that approximately 160,792 users frequented the trail system within the Oil Heritage Region throughout the 2006 calendar year, creating an estimated overall economic impact of roughly $4.31 million.
The Oil Heritage Region has a vast supply of culture, scenic areas, and recreational trail systems. These cultural and natural assets provide a substantial boost in the revitalization of the communities in the area, as well as securing economic growth. The purpose of this study is to determine just how much the trail systems economically benefit the businesses and residents of the Oil Heritage Region.
The Oil Region Alliance of Business, Industry and Tourism (ORA) and the Allegheny Valley Trails Association (AVTA) have contracted with Post, Buckley, Schuh, and Jernigan Inc. (PBS&J) (as an independent private planning consultant), in order to generate a trail utilization study of the trail system within the Oil Heritage Region. To obtain a measure of trail use on the local economy, three major concepts were explored: the frequency/density of trail use; the characteristics of trail users; and types of expenditures performed by trail users.
The trail system within the Oil Heritage Region consists of a network of trail segments. The following greenway trail systems were monitored in the study: the Allegheny River Trail, the Justus Trail, Two Mile Run County Park, the Sandy Creek Trail, the Clear Creek State Forest at Kennerdell, and Oil Creek State Park (See Appendix A: Project Location Map). The waterway trail system was also analyzed on a limited basis in the study. The study was staged throughout the regional trail system and utilized trail counters, user surveys, tally sheets, and business surveys to generate die study's results.
The Trail Utilization Study of the trail system within the Oil Heritage Region was conducted between July 2006 and December 2006. The study was staged throughout the regional trail system and utilized trail counters, user surveys, tally sheets, and business surveys to generate the study's results.
Remote Sensor Portable Traffic Counters were stationed at three different sites for the majority of the study. These locations were the Allegheny River Trailhead at the Salt Box House in Franklin/Cranberry Township, the northern end of the Justus Trail in Oil City, and at the Belmar Bridge on the northern portion of the Sandy Creek Trail. Trail counters were also temporarily situated in Oil Creek State Park (late August through late September) and in the Kennerdell Tract of State Forest (mid-November through December). (Appendix A.)
Remote Sensor Portable Traffic Counters are portable, battery powered active infrared light beam instruments designed for counting moving objects in the outdoor environment. In this specific study, the "moving objects" were the trail users. However, the trail counters cannot always distinguish between a biker, wildlife, and sometimes even plant matter. Thus, care; needed to be used when analyzing the generated data.
The counters operated via a sensor and a reflector. The sensor emitted an infrared light beam across the trail, which was reflected back to the instrument by the reflector. Whenever the beam of light was interrupted, the instrument registered a count and produced the total number of interruptions (users) on the instrument. The counters could retain up to fourteen (14) days of data. Electronic interrogators were plugged into the traffic counters to gain more detailed user information. By using an interrogator, the researcher could obtain up to 14 days of hourly counts from the traffic counters. This data could then be recorded on paper, so that traffic counters could be reset in order to start calculating the next two-week data set.
The data provided by the trail counters were placed into a Microsoft Excel database, so that they could be analyzed. Each trail's data was investigated for total daily use for each month, as well as the median hourly use throughout the course of the study. Medians were used as the measure of central tendency in this portion of the investigation, due to how erratic the counters could be at times. This way a more true measure of trail use could be recorded. Even though the counters provided data throughout the entire day, only counts registered between 0600 and 2100 were included in analyzing the volume of usage on the trails to avoid erroneous counts.
In addition, it should be noted that all three (3) of the counters used throughout the study were not functioning throughout the full month of each month's recordings. Therefore, it was difficult to compare the overall trail usage of each of the trails. Thus, the median of both hourly use patterns and total daily users was calculated in an effort to produce a somewhat accurate comparison between the trail counters within the study. Table 1 displays the recorded data for each trail for each month of the study.
Table 1. Trail counter data available for each month and trail segment 2006| TRAIL SEGMENT | JULY | AUGUST | SEPTEMBER | OCTOBER | NOVEMBER |
| SANDY CREEK TRAIL | 7/3-7/14 | 8/1-8/5 | 9/1-9/7 | 10/1-10/31 | N/A |
| 7/27-7/31 | 8/16-8/31 | 9/20-9/30 | |||
| JUSTUS TRAIL | 7/10-7/31 | 8/1-8/9 | 9/4-9/27 | 10/3-10/4 | N/A |
| 8/12-8/31 | |||||
| ALLEGHENY RIVER TRAIL | 7/4-7/13 | 8/15-8/31 | 9/1-9/5 | 10/1-10/31 | 11/1-11/2 |
| 7/15-7/23 | 9/23-9/30 | ||||
| 7/26-7/27 | |||||
| OIL CREEK STATE PARK | N/A | 8/24-8/31 | 9/1-9/23 | N/A | N/A |
| KENNERDELL STATE FOREST | N/A | N/A | N/A | N/A | 11/14-11/22 |
It should also be noted that the counters do not provide an entirely accurate count of users entering the various trailheads. Because some users both enter and exit at the same trailhead, they may pass the traffic counter and be counted twice. However, some users may enter at one trailhead and then exit at another location. Thus, one cannot assume that the trail counters are simply double that of the actual count of users. Also, if a group of people were to pass by the counters simultaneously, the counter may lump the users as one "interruption". Therefore, some users may be missed by the traffic counters. In order to combat these problems, an actual tally of how many users were on the trail was done for brief specific hours during the study to provide a means of translating the traffic counter numbers into actual counts of trail use. However, this data was limited and differed from trail to trail.
Since this issue was addressed in a similar trail study conducted by the University of Pittsburgh, "The 2002 User Survey for the Pennsylvania Allegheny Trail Alliance", an equation was developed to compare the two differing values to provide more accurate results. Therefore, this analysis has adopted that same equation, assuming a similar empirical relationship exists in our trail system, for this trail study. The equation is:
This equation is reflected in the values that were generated for the trail counts in the tables and figures below (Table 1A, 1B, 1C and Figure 1A, 1B, 1C).
Belmar Bridge in Sandy Creek TownshipOne of the traffic counters was placed at the northern trailhead of the Sandy Creek Trail at the Belmar Bridge and was checked bi-weekly from the beginning of July through October.
Table 1A. Median hourly use patterns at the Belmar Bridge on the Sandy Creek Trailhead 2008| MEDIAN HOURLY USE PATTERNS AT BELMAR BRIDGE TRAILHEAD | ||||||||||||||||
| Month | 0600 | 0700 | 0800 | 0900 | 1000 | 1100 | 1200 | 1300 | 1400 | 1500 | 1600 | 1700 | 1800 | 1900 | 2000 | 2100 |
| July | 0.0 | 0.0 | 1.3 | 3.3 | 8.5 | 6.9 | 10.2 | 12.2 | 5.9 | 6.6 | 5.9 | 3.9 | 2.6 | 5.3 | 3.9 | 2.0 |
| August | 0.0 | 0.7 | 1.6 | 3.0 | 7.6 | 4.9 | 6.2 | 3.9 | 6.9 | 3.6 | 4.3 | 4.3 | 3.9 | 4.6 | 3.9 | 0.3 |
| September | 0.0 | 0.0 | 1.3 | 2.0 | 2.0 | 3.3 | 4.9 | 5.9 | 3.9 | 6.2 | 3.3 | 3.0 | 4.6 | 3.3 | 0.0 | 0.0 |
| October | 0.0 | 0.0 | 0.7 | 0.7 | 2.0 | 3.9 | 4.3 | 4.9 | 5.6 | 3.3 | 2.3 | 3.0 | 2.6 | 0.7 | 0.0 | 0.0 |
Figure 1A illustrates, the median number of hourly trail users throughout the course of the study. The figures displays a relatively normal distribution of trail users throughout the day with peak use occurring between 1100 (11:00 AM) and 1500 (3:00 PM).
 Justus Trailhead in Oil City
A traffic counter was placed at the northern end of the Justus Trailhead near the trail side fitness station area and was checked bi-weekly from mid-July through the beginning of October.
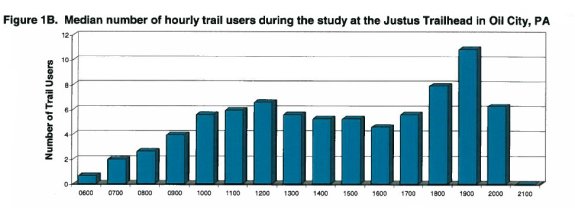
Table 1B. Median hourly use patterns at the Justus Trailhead in Oil City , PA 2006| MEDIAN HOURLY USE PATTERNS AT JUSTUS TRAILHEAD | ||||||||||||||||
| Month | 0600 | 0700 | 0800 | 0900 | 1000 | 1100 | 1200 | 1300 | 1400 | 1500 | 1600 | 1700 | 1800 | 1900 | 2000 | 2100 |
| July | 2.0 | 2.0 | 5.6 | 9.2 | 5.6 | 6.6 | 5.9 | 5.3 | 5.9 | 3.9 | 4.6 | 4.3 | 7.2 | 11.2 | 9.2 | 1.3 |
| August | 0.7 | 1.6 | 2.6 | 3.9 | 5.9 | 5.9 | 6.6 | 6.6 | 5.3 | 5.3 | 3.9 | 5.6 | 8.2 | 10.8 | 6.2 | 0.0 |
| September | 0.0 | 2.3 | 2.6 | 3.3 | 4.6 | 3.6 | 7.9 | 5.6 | 5.3 | 5.9 | 5.3 | 7.2 | 7.9 | 8.5 | 1.3 | 0.0 |
Figure 1B illustrates the median number of hourly trail users throughout the course of the study. The figure displays a relatively normal distribution of trail users throughout the day, but then experiences an additional peak in the evening hours. The Justus Trail is most heavily used at noon and then between 1700 (5:00 PM) and 20Q0 (8:00 PM). This data suggests this trail is used heavily by local users who are able to use the trail during lunch hours and then again in the evening.
A trail counter was placed at the northern trailhead of the ART near the Salt Box House in Cranberry Township along U.S. Route 322 cast of Franklin, and was checked bi-weekly from the beginning of July until the beginning of November. 'However, the counter did malfunction for a few weeks during the month of September and needed to be sent off-site for repairs. Therefore, there is a limited amount of data during this month.
Table 1C. Median hourly use patterns on the All hen River Trail 2006| MEDIAN HOURLY USE PATTERNS ON ALLEGHENY RIVER TRAILHEAD (SALTBOX) | ||||||||||||||||
| Month | 0600 | 0700 | 0800 | 0900 | 1000 | 1100 | 1200 | 1300 | 1400 | 1500 | 1600 | 1700 | 1800 | 1900 | 2000 | 2100 |
| July | 0.0 | 2.6 | 6.2 | 10.5 | 14.5 | 17.1 | 17.1 | 15.8 | 19.7 | 15.8 | 14.5 | 14.5 | 16.4 | 8.5 | 5.9 | 0.7 |
| August | 0.0 | 3.9 | 4.6 | 3.3 | 7.2 | 9.2 | 10.8 | 10.2 | 11.2 | 12.2 | 8.9 | 10.8 | 13.5 | 10.8 | 5.6 | 0.7 |
| September | 0.0 | 1.3 | 2.6 | 3.3 | 5.9 | 2.0 | 1.3 | 5.3 | 7.2 | 5.9 | 5.9 | 7.2 | 3.3 | 2.6 | 0.0 | 0.0 |
| October | 0.0 | 1.3 | 1.3 | 1.3 | 2.6 | 2.3 | 3.6 | 5.9 | 2.6 | 4.3 | 3.9 | 3.6 | 3.6 | 0.7 | 0.0 | 0.0 |
Figure 1C illustrates the median number of hourly trail users throughout the course of the study. It shows a relatively even distribution of trail use throughout the course of a day. The trail is heavily used between 0900 (9:00 AM) and 1900 (7:00PM). There is no real pattern of significant periods of dramatically low or high usage times. The trail is busy from mid-morning until the evening hours.

The median number of total trail users throughout each month of the study was also calculated and is illustrated in Figure 2. The available data at the following locations (ART at the Salt Box House, Justus Trailhead, and Sandy Creek Trail at the Belmar Bridge) were tabulated for July through October. OCSP data was provided by the park system database for July, August, and October. September usage volumes were tabulated in the same manner as the prior trail counter data.

Of the study months, July registered the highest number of total daily users, while the ART at the Salt Box House was indicated to be the most abundantly used trail. It was also the trail that was the most affected by seasonality, displaying dramatic decreases in trail use as the study approached the colder months. The Justus Trailhead displayed a much less significant decrease in usage throughout the duration of the study. The access point at the OCSP Bike Trail peaked in August and then dramatically decreased in use by October. The Sandy Creek Trail at the Belmar Bridge was the least affected by the change in the seasons; the volume of use remained relatively constant throughout the study period.
Trail counters were utilized so that the volume of trail users could be tabulated throughout the duration of the study. However, because of how irregular the monthly counter data was, one could not simply sum up these values to develop total usage patterns. Therefore, each trail segment's monthly median value of total daily trail users (illustrated in Figure 2 and shown below in Table 2A) was multiplied by the number of days per month and then the trail segments were totaled for overall usage of these four (4) access points from July through October. The calculated total number of users over the study period that were recorded by the trail counters at these four (4) sites was 42,430 trail users.
Table 2A. Number of users captured b trail counters on the evaluated trails from July - October| Trail Segment | July | August | September | October |
| Median Number of Daily Users on Each Trail Segment | ||||
| ART | $249.00 | $169.50 | $88.00 | $38.80 |
| Justus | $102.50 | $86.10 | $77.20 | $65.62 |
| Belmar Bridge | $73.30 | $44.00 | $56.50 | $49.90 |
| OCSP | $74.50 | $126.80 | $49.60 | $14.50 |
| Trail Segment | Total Monthly Users on Each Trail Segment | |||
| ART | $7,719.00 | $5,254.50 | $2,728.00 | $1,202.80 |
| Justus | $3,177.50 | $2,669.10 | $2,393.20 | $2,034.22 |
| Belmar Bridge | $2,272.30 | $1,364.00 | $1,751.50 | $1,546.90 |
| OCSP | $2,309.50 | $3,930.80 | $1,537.60 | $449.50 |
| Total | $15,478.30 | $13,218.40 | $8,410.30 | $5,233.42 |
| Total Number of Users in Study Period on All Four Segments: | 42,340.00 | |||
Since the study did not run throughout the course of the year, nor did it include some trailhead entrances, a number of trail users were not captured in the trail counter data when attempting to calculate actual trail usage. Per the request of the ORA and AVTA, a rational analytical method was developed to determine estimated annual trail use throughout the entire trail system on an annual basis. The following factors were examined in this section in order to provide an estimate of trail use over the course of the past year:
Additional Access Points that Were Not Captured by Trail Counters
Trail counters provided data for major trailhead access points on the ART, at
OCSP, the Sandy Creek Trail, and the Justus Trail. However, each of the trail
segments has multiple access points with parking. Thus, a number of trail users
were not captured by the trail counters, because these users entered the trail
at a different access point. In order to compensate for this missed data, the
following assumptions were made at each of these four trail segments in Table 3:
| Trail Segments | Trailhead Counted | Additional Trailheads | Inclusion Multiplier |
| Allegheny River Trail | Franklin | Deep Hollow/Brine Plant, Brandon St. George, Rockland Station, Dotter, Emlenton | 1.5 |
| Sandy Creek Trail | Belmar | Rockland Road, Van, Fishermen's Cove | 1.5 |
| Justus Trail | Oil City | Franklin (up towards Oil City) | 1.5 |
| Oil Creek State Park Trail | Petroleum Center | Jersey Bridge and multiple trailheads | 2.5 |
The inclusion multiplier is included to account for the trail users deemed "missed" in the study. Thus, it is assumed that one-third (1/3) of the trail users along the ART, Sandy Creek Trail, and Justus Trail were not accounted for and that three-fifths (3J5) of the trail users were not counted along the trail system at Oil Creek State Park. These proportions of users "missed" wore incorporated into Table 4 below, which is a revision of Table 2A in which the trail segments were multiplied by the inclusion multiplier to determine an estimated number of trail users.
Additional Trails Not Measured
Available data in Figure 23B provide results of the percentage of use per trail
segment over the entire trail system based on responses from the User Survey.
The percentage of responses per trail segment included the following statistics:
|
|
Therefore, since Kennerdell Tract of State Forest, Two Mile County Park, the Water Trails, and "Other" were not counted, it is assumed that 14% of the total projected trail users were not captured on these remaining trails.
The 14% of users "missed" over the study period was also incorporated into Table 4 to develop a total trail usage amount. It displays both the "Total Number of Users in Study Period on All Four Segments" and the "Total Number of Users in Study Period of Entire Trail System". The latter usage amount accounts for both the four monitored trail segments (72,746 users) and those trails included in this section that were not incorporated into the trail count (10,184 users). It lists a total of 82,930 persons (72,746 + 10,184) utilizing the entire trail system over the course of the study period. An estimated 82,930 trail users accessed the trail system within the Oil Heritage Region over the course of the study period from July through October.
Table 4. Revision of Table 2A + the additional trail segments that were not counted| Trail Segment | July | August | September | October |
| Median Number of Daily Users on Each Trail | ||||
| ART | $373.50 | $254.25 | $132.00 | $58.20 |
| Justus | $153.75 | $129.15 | $115.80 | $98.43 |
| Belmar Bridge | $109.95 | $66.00 | $84.75 | $74.85 |
| OCSP | $186.25 | $317.00 | $124.00 | $36.25 |
| Trail Segments | Total Monthly Users on Each Trail Segment | |||
| ART | $11,578.50 | $7,881.75 | $4,092.00 | $1,804.20 |
| Justus | $3,408.45 | $4,003.65 | $3,589.80 | $3,051.33 |
| Belmar Bridge | $5,773.75 | $2,046.00 | $2,627.25 | $2,320.35 |
| OCSP | $5,773.75 | $9,827.00 | $3,844.00 | $1,123.75 |
| Total | $26,534.45 | $23,758.40 | $14,153.05 | $8,299.63 |
| Total Number of Users in Study Period on All Four Segments: | $72,746.00 | |||
| Total Number of User in Study Period of Entire Trail System: | $82,930.00 | |||
Effects of Seasonality on Trail Use:
The above two assumptions provide an estimate for total trail use over the study
period, but do not account for trail use on an annual basis. To determine an
amount of annual usage, the survey questionnaire was utilized. Question 8 of the
survey provided a response in terms of trail use over the four seasons. By
calculating the response rate of use for the various seasons, an estimate of
seasonal trail use was obtained. By extracting this data plus the available
estimates of use stated above, an overall annual estimate of trail use was
calculated.
In Question 8, trail users were asked to rank their seasonal trail use from one to four (1--most amount of use, 4=least amount of use). The seasons were given a"1" ranking a total of 307 times in the surveys. The following seasons received "1" rank in terms of use in the trail user survey:
Total Summer Use =[(3/2)*[(July Use + August Use)]/86%=(3/2)*(58,480.1)
= 87,720 people
Total Fall Use =(3/2)*[(September Use + October Use)]/86% = (3/2)*{26,107.8)
= 39,162 people
Summer Use =(Total Annual Use)*(47%)
Fall Use = (Total Annual Use) *(30%)
Winter Use = (Total Annual Use) *(5 %)
Spring Use = (Total Annual Use)*(18%)
Total Annual Use =(Total Summer Use)/(47%)
OR
Total Annual Use =(Total Fall Use)/(30%)
Total Annual Trail Use [(Summer)/(47%)]+[(Fall)/(30%)]/2 = (317,177)/(2)
= 158,589 total trail users
Winter = (5%)*(Total) = 7,929 people
Spring = (18%)*(Total) = 28,545 people
| User Type | Amount |
| Total Summer Users | 87720 |
| Total Fall Users | 39162 |
| Total Winter Users | 7929 |
| Total Spring Users | 28545 |
| TOTAL ANNUAL USERS | 158589-163356 (Average: 160792) |
Therefore, the estimated number of trail users who frequented the trail system within the Oil Heritage Region throughout the calendar year of 2006 ranged between 158,589 - 163,356 people. The average populace of this range is 160,792 users.
In order to gain a better understanding of the types of users who frequent the trails, as well as to determine the accuracy of the trail counters, site visits were conducted. A study group of volunteers tabulated the number and types of users who entered the trail system within the Oil Heritage Region at various access points. Due to the limited number of volunteers and a prior rain out, the trail visit was conducted as a weekend event on Saturday, October 7, with the exception of one trail visit that took place on Sunday, October 8.
To conduct trail visits, volunteers were provided tally sheets ( Appendix E) and were dispersed at seven (7) different access points throughout the trail system. Two (2) shifts of volunteers were developed. Count-, occurred simultaneously and captured both morning and afternoon users. The AM shift was held from 10 AM to 12 PM and the PM shift lasted from 2 PM to 4 PM. The PM shift generated a much higher volume of trail users than the AM shift, which was most likely due to the chilly morning temperatures that day. The Sunday shift also tabulated much higher usage volumes at the same time and location than Saturday's shift. This was also most likely a weather-related incident, because the weather on Sunday was very warm and sunny. However, the trailhead did experience slightly higher usage volumes on Sunday than Saturday with an average number of total daily users totaling 150 and 165 users, respectively.Volunteers were stationed to provide user counts, but they could also conduct trail interviews. Volunteers at random locations kept tabs of where non-local trail users traveled from (Pittsburgh, Ohio, Meadville, Harrisburg, etc.) and also collected quotes from what the trail users said about the trail. Some examples include:
The total number of users is tabulated in Table 2 from the weekend's events, while Figure 213 illustrates the type of activities the trail users were partaking in.
Table 6. Tall sheets of trail users observed on Oct 7- 8 only)| Saturday, October 7, 2006 | ||||||||||
| Trail Segment | Time | Bikers | Runners | Walkers | Skaters | Wheel Chairs | Water Trail | Hunters | Hikers | Total |
| Belmar Bridge | PM | 33 | 0 | 13 | 0 | 0 | 0 | 0 | 0 | 46 |
| ART - Belmar to Sunny Slopes | AM | 17 | 0 | 5 | 0 | 0 | 27 | 0 | 0 | 49 |
| ART - Belmar to Sunny Slopes | PM | 43 | 0 | 4 | 0 | 0 | 16 | 0 | 0 | 63 |
| ART - Franklin to Belmar | PM | 73 | 0 | 2 | 1 | 0 | 0 | 0 | 0 | 76 |
| Jersey Bridge | AM | 12 | 1 | 11 | 0 | 0 | 4 | 0 | 0 | 28 |
| Jersey Bridge | PM | 93 | 0 | 26 | 0 | 0 | 0 | 2 | 24 | 145 |
| Justus | PM | 35 | 0 | 8 | 0 | 0 | 0 | 0 | 0 | 43 |
| OCSP | AM | 39 | 0 | 0 | 0 | 0 | 1 | 0 | 0 | 40 |
| OCSP | PM | 63 | 0 | 20 | 0 | 0 | 4 | 0 | 6 | 93 |
| Sandy Creek - Belmar - Rockland - Van | AM | 32 | 0 | 2 | 0 | 0 | 0 | 0 | 0 | 34 |
| Sandy Creek - Belmar - Rockland - Van | PM | 62 | 0 | 12 | 0 | 1 | 0 | 0 | 0 | 75 |
| TOTAL | - | 502 | 1 | 103 | 1 | 1 | 52 | 2 | 30 | 692 |
| Sunday, October 8, 2006 | ||||||||||
| Belmar Bridge | PM | 191 | 0 | 53 | 1 | 0 | 0 | 0 | 0 | 245 |

Almost 700 users were witnessed entering these seven (7) trail segments over a total of four (4) hours on Saturday, with the OCSP Jersey Bridge and the Sandy Creek Trail being the most heavily accessed points. Sunday's trail visit totaled 245 users at only one location during one shift, which is quite dramatic. Most of the users entering the trails were bikers, encompassing the activities undertaken by almost three-quarters of the trail users. Walkers and water trail users (predominantly fishermen) were the next largest categories in terms of trail use.
|
|
Note. Survey location codes were not included on the first round of surveys that were distributed. Therefore, some surveys were unable to be analyzed when comparing data among differing- trail segments in the study.
 Oil Creek State Park (office at the Petroleum Centre), Drake Well Park Museum
(lobby or gift shop), the Salt Box House, and the ORA's office also served as
distribution centers, in addition to the trailside survey locations. Some
surveys were mailed to the trail user-, via an address list that was provided
by the OCSP database system, as well as the AVTA's guest log book. To generate
more water trail user responses, surveys were also mailed to the participants
of some of the Allegheny River fishing tournament,; held by the ORA.
Oil Creek State Park (office at the Petroleum Centre), Drake Well Park Museum
(lobby or gift shop), the Salt Box House, and the ORA's office also served as
distribution centers, in addition to the trailside survey locations. Some
surveys were mailed to the trail user-, via an address list that was provided
by the OCSP database system, as well as the AVTA's guest log book. To generate
more water trail user responses, surveys were also mailed to the participants
of some of the Allegheny River fishing tournament,; held by the ORA.
Survey forms were divided into five different categories (A - E), so that information could be obtained on the user's trip profile, visitor profile, expenditures, demographic information, and attitudes on the trail system's attributes. (Appendix ii) The survey consisted of twenty-three (23) questions geared toward trail user activities, frequency of trail use, amount of time and money spent by trail users, and opinion questions to determine what the users' attitudes were toward current trail attribute condition., and what types of trail amenities were important to them.
This section was created to gain information on where the survey respondent resided, how many people were in his/her party, the distance the trail users traveled to visit the trails, and what types of activities the trail user(s) participated in while visiting the trail system within the Oil Heritage Region.
1. What is your residence Zip Code?This question enabled the study team to determine where the trail users were traveling from to access the trails. Thus, one can gain an undemanding on how well-known the trails are throughout the country, as well as the willingness of these respondents to travel to the trails in the area. Figure 3A illustrates the ratio of respondents across North America.

Most users were from Pennsylvania, which encompassed over three-quarters of the survey users. The next most popular, states to visit the trails were Ohio and New York. A couple from Canada also frequented the trails, and indicated that they would return with more users.
Because such a large number of trail users were from Pennsylvania, users in this mate were further categorized into regions within the state (Figure 3B):
|
|

Regional usage patterns across PA were spread relatively evenly among Western, Northwest, and South West PA, as well as the Oil Heritage Region. This would be expected, since the Oil Heritage Region is located in Western PA. The trail system experienced very little use from residents in Eastern or Central PA during the study period.
2. How many people, including yourself, are in your group? ____people
Group size is an important dynamic of trail use. Survey respondents were questioned about the number of people visiting the trails. Almost half of the trail users indicated that they frequented the trails with another person. One in every five trail users visited the trails alone. One-third of the trail users traveled in groups of anywhere from three to ten people. A fraction of groups consisted of anywhere from twelve to thirty trail users. The average group size was 2.78 people, while the median number of users in a group was two (2) people.

2a. Are any children under the age of 15 with you on your trail experience
today?
•Yes
•No
2b. If YES, how many are:
•"Under age 10"
•"Ages 10-14"
The number of trail users who brought their children on the trails with them is displayed in Table 7, below. Most users preferred to use the trails alone or with other adults. Few survey respondents indicated that they brought children under the age of 15 with them, and the majority of these children were at least of adolescent age (10-14 years old).
3. Did you stay last night, adjacent to the trail system?
•Yes
•No
If NO, how far did you travel to get to where you entered the trail today? _____miles
The responses to this question are illustrated in Figure 5 and Figure 6. The majority of trail users (83%) did not stay adjacent to the trails, thus indicating that most users were "day-trip users", Almost half of the trail users traveled a distance of anywhere from 0 to 20 miles to reach the trails. About one-third of the trail users traveled anywhere from 40 to 80 miles to reach the trail. Few (5.7%) traveled greater than 100 miles to access the trail, which roughly corresponds with Figure 3. The average distance traveled by trail users was 33.25 miles; the median distance was 20 miles.


4. What is your primary activity on the trail? (Circle all that apply.)
To determine what activity users most enjoy, survey respondents were questioned about their primary fitness activity while on the trails. Biking was, by far, the most dominant response to this question, encompassing almost three-quarters of survey respondents. Walking was the next most popular response, totaling almost one-third of respondents. Fishing included a small percentage of users, but this activity was not even included on the survey for Question #4, and was written in by a number of users, indicating strong interests in this recreational activity. Only a small amount of trail users rollerblade or go horseback riding along the surveyed trails.

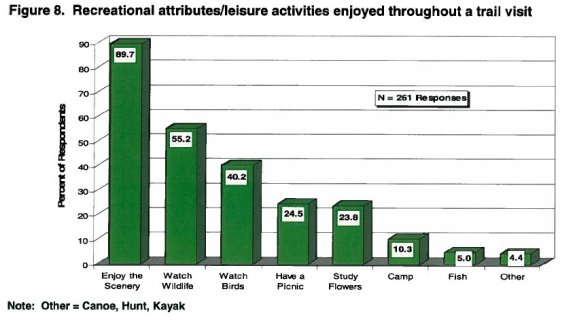
5. During your trail visit did you: (Circle all that apply.)
Respondents were questioned about the types of recreation that they partake in to determine what the most popular recreational features are within the trail system within the Oil Heritage Region. The majority of trail users (90%) mostly enjoy the scenery along the trails. About half of the respondents indicated that they either observe wildlife or go birding. One quarter of the trail users enjoy a picnic and/or identify wildflowers, while on the trails. A small amount of the users (10%) go camping, while fewer users partake in hunting, fishing, canoeing, or kayaking.
6. Would you consider your use of the trail to be for: (Circle one response.)
This question was generated to determine what drives people to actually use the trails. Twothirds of respondents indicated their reasoning to be for recreation, while almost half stated that their reasoning was due to health benefits. Few trail users (3%) train for marathons or triathlons. None of the users indicated that their purpose for using the trails was for commuting. Since the Oil Heritage Region is rural, it would seem logical that utilizing the trail to commute to work would be highly unlikely.

This section of the survey was generated to determine the frequency of use, effects of seasonality, and weekly usage patterns of the trail system. The number of first time users and the frequency of use by more established trail users aid in determining interest levels of the trails. Trail users were also asked to indicate how they discovered the trails, which shed some light on the best means of communicating, the existence of the trails to draw in new users.
7. How often, on average, do you use this trail system'?
___First Time ___Once a Month ___Once a Week ___3-5 Times/Week ___A Few Times a Year ___A Few Times a Month ___2 Times/Week ___Daily

Over 15% of respondent,, indicated that this was their first time visiting the trail system within the Oil Heritage Region and many of these users indicated willingness to visit the trails again. However, over half of the trail users indicated that they only use the trails a few times a year, Approximately 15% of respondents utilize the trail at least once a week; and nobody stated that they used the trails daily.
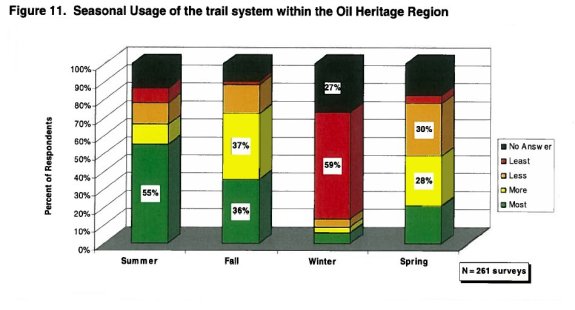
8. Rank pour trail usage by season from 1 to 4(1=most, 4--least):
___Summer ___Fall ___Winter ___Spring
Users were asked to rate seasonal trail usage on a scale from one to four to determine tile most popular trail season. Figure I1 displays various colors corresponding to the number rating scale (green=1, yellow--2, orange=3, red=4, black--no rating given). Fall and summer were the most popular seasons to utilize the trail, followed by spring, and then winter. Over three-quarters of trail users rated fall with either a"1" or "2" in term-, of use. Summer displayed the highest number of Is" as its rating, but only a small portion of "2s". Spring was relatively split in terms of use. Winter was a very unpopular season for trail use. The majority of trail users indicated that least amount of trail use in the winter season by rating it a "4", and another one-third of respondents id not even rate the season.
9. Generally, when do you use the trail? (Circle one response.)
•Weekdays
•Weekends
•Both
Users were asked to identify when they were on the trails to determine the weekly usage patterns. Weekends were the most popular times to visit the trails followed by the combination of bath weekend and weekday use. Only one in five respondents stated that they use the trails exclusively on weekdays.

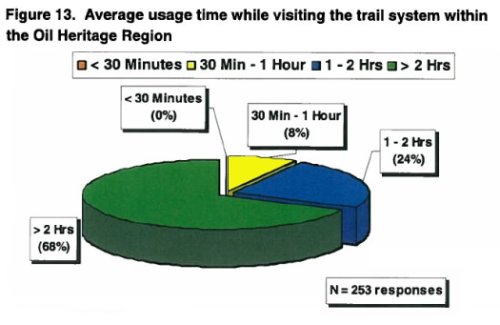
10. How much time do you generally spend on the trail each visit? (Circle one response.)
To determine the intensity of trail use, trail users were asked to choose the amount of time that they spend on the trails during a typical trail visit. The majority of trail users enjoy the trails for greater than two hours at a time (68%) and no one indicated their trail use to be under 30 minutes. Thus, when people visit the trails, they often stay lot significant periods of time.
11. How did yau find out about the trail? (Circle all that apply.)
Users were asked to indicate which of the following communication means were used o discover the trail system within the Oil Heritage Region. By far the most typical form of obtaining knowledge of the trails' existence was via word of mouth. The internet and newspaper were also fairly successful in providing information about the trails.

This section of die survey was implemented to gain insight into how die Oil Heritage Region is economically impacted by trail users visiting the area. Thus, trail users were asked to indicate the types of accommodations that they stayed in and their spending habits in the region.
12. Is the trail system a main reason for this trip to the Oil Heritage
Region?
•Yes
•No
13. Is your visit to the Oil Heritage Region an overnight trip away from home?
•Yes
•No
The majority of trail users (72%) indicated that the trails were the main reason for the trip to the area. Since only 20.5% of the trail users reside in the Oil Heritage Region, the trails serve as an important recreational asset in drawing non-local residents into the Oil Heritage Region. However, this same percentage of users also stated that their trip did not involve an overnight stay. Thus, most users utilize the trails and then return home or proceed to their next destination.

If your trip was an overnight was an overnight stay:
13a. How many nights will you be staying in the Oil Heritage Region? _____nights
Of the 30% of respondents who indicated that their trip involved an overnight stay, the following stayed anywhere from one to twelve nights in the area. The average length of stay in the area was 2.24 nights, while the median length of stay was two nights.

13b. What type of accommodation is your group staying in for the duration
of your visit in the Oil Heritage Region?

It was important to note what types of accommodations the rail users were residing in during their overnight trips to the Oil Heritage Region. Many trail users (30%) stayed in a campground. A quarter of trail users stayed in either a motel/hotel or a friend or relative's home. The Lean-To's located in Oil Creek State Park were also fairly popular, housing 20% of overnight trail users. Despite a considerable number of users staying in a hotel/motel, only a fraction of users stayed at a Bed & Breakfast (B&B).
14. What was/will be the total spending of your whole group in the Oil
Heritage Region during your visit (or during your most recent visit) for the
following categories?
Lodging: $______ Recreation Related: Food & Beverage: Bike Rental $______ Foods/drinks consumed at restaurants or bars $______ Biking Equipment $______ Snack foods/groceries/ice cream/carry-out $______ Boat Rental $______ Transportation: Any Other Expense: Gasoline, oil, repairs $______ Footwear, Clothing, Film, Etc. $______ Other (airfare, vehicle rental) $______
Total trail-related expenditures were tallied for each spending category listed above for the trail user responses in the survey. Expenses were divided into categories to determine the types of spending performed by trail users; the categories were then totaled to obtain the impact of these expenditures on the Oil Heritage Region.

Survey respondents spent a total of $18,168 in the Oil Heritage Region during the study period. Overall, trail users spent the majority of their money on dining out and lodging. The greatest amount of total spending occurred in the "Dine-Out" category, which included any foods or drinks consumed at restaurants or bars in the area. "Lodging" was the second highest income generator for the area, followed by gasoline sales. "Snack foods" (including groceries/ice cream/carry-out) and "Bike Equipment" also brought in a fair amount of money by trail users.
Because non-local users and local users often have different types of expenditures, the survey group was further studied for spending habits within the Oil Heritage group versus the non-local users group. Table S displays the overall expenditures of the two user groups. Table 9 goes into further detail to display the various expense categories and how much was spent by each user group.
Table 8. Oil Heritage User vs. Non-Local User: Daily Expenditures
Type of User
# of Groups
# of Users
Total $
Avg $/Group
Avg $/User
Median $/Group
Oil Heritage Redidents
50 (19%)
147 (21%)
$545.27
$10.91
$3.71
$0.00
Non-Local Users
211 (81%)
567 (79%)
$18,672.10
$88.49
$32.93
$35.00
Oil Heritage users were categorized according to their zip code response that was illustrated in Question I of the survey responses. Non-local users were then considered to be all other users that were not residents of this defined region. Oil Heritage residents encompassed 21% of total users and 19% of total surveys (groups) that were submitted, while non-local users totaled 79% of total users and 81% of submitted surveys (groups). Naturally, the local (Oil Heritage) users spent much less while visiting the trails than the non-local users. Oil Heritage resident trail users spent, on average, $3.71 daily per person, while non-local users spent, on average, $32.93 per person.
Table 9. Oil Heritage User vs. Non-Local User: Types of Expenditures
OIL HERITAGE USERS
NON-LOCAL USERS
Expenditure
Avg/User
Ave/Group
Total
Expenditure
Avg/User
Ave/Group
Total
Restaurants/Bars
$1.80
$5.30
$265
Restaurants/Bars
$8.77
$23.56
$4,972.00
Bike Equipment
$0.48
$1.40
$70.00
Lodging
$8.64
$23.21
$4,898.00
Gas
$0.44
$1.29
$64.27
Gas
$7.02
$18.87
$3,982.00
Snack Foods
$0.39
$1.16
$58.00
Snack Foods
$3.56
$9.58
$2,021.10
Other Exp
$0.35
$1.02
$51.00
Bike Equipment
$2.83
$7.60
$1,604.00
Other
$0.18
$0.52
$26.00
Other Exp
$1.07
$2.88
$608.00
Lodging
$0.07
$0.22
$11.00
Boat Rental
$1.00
$2.69
$567.00
Bike Rental
$0.00
$0.00
$0.00
Bike Rental
$0.04
$0.09
$20.00
Boat Rental
$0.00
$0.00
$0.00
Other
$0.00
$0.00
$0.00
Total
$3.71
$10.91
$545.27
Total
$32.93
$88.49
$18,672.10
The types/amount of expenditures that were performed by both Oil Heritage users and non-local users is displayed in Table 9. Oil Heritage users claimed to spend most of their money, by far, on restaurants and bars, while visiting the trails. This expenditure category made up almost half of the average amount spent per user. Non-local user spending habits were geared predominantly toward restaurants/bars, lodging, gas, snack foods, and bike equipment, respectively.
Since a much larger group of visitors was estimated to be on the trails than those who were surveyed, the overall economic impacts were much greater than 413,168 for the region. In order to determine the overall economic impacts, the 21% of Oil Heritage users who spent an average of $3.71 per person and 79% of non-local users who spent an average of $32.93 were incorporated into the trail user estimates.
Study Period = {[(82,930 users) x(21%) x($3.71/user)] +[(82,930 users) x(79%) x($32.93/user)]}
= $2,222,010
Year of 2006 ={[(160,792 users) x(21%) x{$3.71/user}] +[{160,792 users) x(79%) x ($32.93/user)]}
= $4,308,229
An estimated 82,930 users who visited the trails between July and October, created an economic benefit of over $2.22 million for the region. This impact extended throughout the whole year is estimated to be almost $4.31 million due to an estimated 16U,792 users frequenting the trails in 2006.
This number also does not include personal incomes generated due to employment. Nor does this question include the intrinsic values and benefits that the trails bring to the region, such as recreational, scenic, and health benefits. Therefore, even though this number is substantial, its economic benefits of the trails run much deeper than simply generated revenues.
This section collected information on the characteristics of people utilizing the trails. Age, gender, employment status, and income questions were all included in this portion of the survey questionnaire.
15. What is your age?
A. 15-25 C. 36-45 E. 56-65 B. 26-35 D. 46-55 F. Over 65

The distribution of ages of trail uses was weighted heavily on the middle-aged to elderly cohort encompassing three-quarters of the crowd. Trail users were predominantly middle-aged, with only a small portion of trail users who were under 36 years old. Only 8% of the respondents indicated that they are 35 years or younger.
16. What is your gender? A. Female B. Male
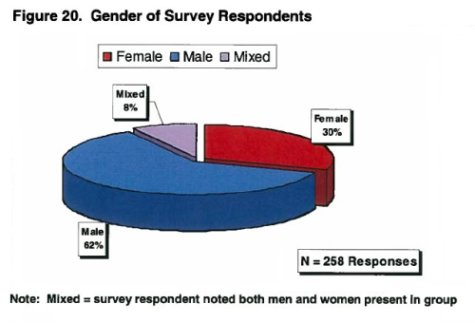
The majority of respondents (62%) indicated that they were male, while only 30% indicated they were female. However, it is difficult to ascertain whether more males utilize the trails, or rather, if more males would fill surveys out on behalf of their user group. Thus, one cannot assume that more males frequented the trails, only that more men filled out the surveys and indicated their gender, even in the presence of a mixed-gender group.
17. What is your employment status?
A. Student
B. Employed -Professional
C. Employed -Skilled Laborer
E. Not currently working
D. Retired
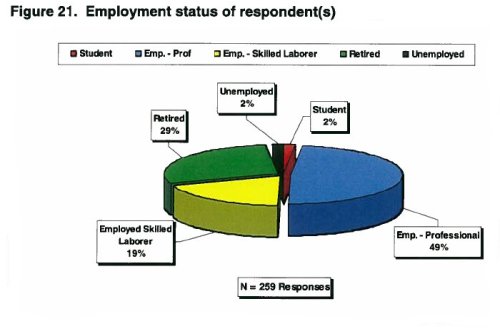
Trail users were asked to identify their employment status. Almost half of the trail users indicated that they were employed in the professional sector, while another 30% indicated that they were retirees. Thus, an older, more educated crowd tends to frequent the trails.
18. What is your annual pre-tax household income?
A. Under $40,000
B. $40-59,999
C. $60- 79,999
D. $80 - 99,999
E. $100 -119,999
F. $120 - 139,999
G. $140 - 159,999
H. $160 -179,999
I. $180-199,999
J. $200,000 and over
Trail users were asked to identify their level of pre-tax household income in order to gain some insight on the put-chasing power of the trail user. This question was the most frequently omitted question in this section, because some users felt that the level of income earnings was private and they did not feel comfortable revealing that information.

However, those respondents who felt comfortable answered die question and provided a wide range of responses. Incomes included a variety of earning ranges, with the most popular response being those trail users who earn between "$40 - $59,000" annually. One-quarter of the survey respondents indicated that their household earnings was "Under $40,000", of which 25% were retirees. Almost 50% of trail users' households earned anywhere from $60,000 to $200,000 annually.
This was the final portion of the user surveys and was included to gain insight about the users' attitudes of the trail system within the Oil Heritage Region. This section also provided the user with the opportunity to add any additional comments or suggestions that were not able to be answered elsewhere on the survey.
19. Which trail(s) do you use throughout the year in the Oil Heritage
Region? (Check all that apply.)
Survey respondents were asked to indicate which trails they use throughout the year. Survey respondents could select more than one trail segment in terms of use. Therefore, the responses to this question were illustrated in two different manners. Figure 23A illustrates the number of times each trail segment was selected in comparison to the total number of available surveys (a total number of 261 surveys were submitted). Figure 23B illustrates the number of times that a trail segment was selected in comparison to the total number of selections that were made in all of the surveys (a total number of 715 responses/selections were made for this question in the 261 total surveys).
The four (4) most commonly selected trails were: the ART, the OCSP Bike Trail, the Sandy Creek Trail, and the Justus Trail, respectively to ascertain which trails were used most abundantly. The majority of surveys indicated that these trails were used throughout the year (Figure 23A). These four trails were cited as being used in 86% of the total number of responses (Figure 23B).
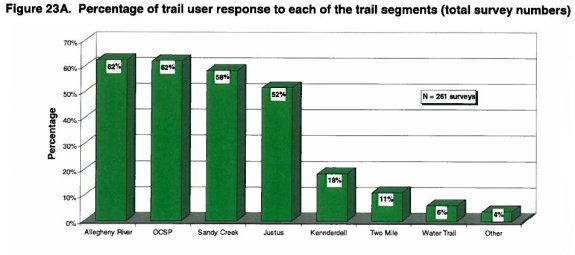

The Kennerdell State Forest Trail was the next most abundantly used, encompassing 18% of users, while the Two-Mile Run Trail received indications of usage from 11% of survey respondents. Even though most of the surveys were completed by greenway trail users, some users (7%) indicated that they also used the water trails.
20. Please rate the following m terms of importance to you and then
current conditions (only, if they apply).
Importance to you
Condition Today
Recreation Attributes
High
Med
Low
None
Excel
Good
Fair
Poor
Non-
Existent
1. Parking
2. Natural Scenery
3. Amount of Shade
4. Restrooms
5. Trail Maintenance
6. Water Fountains
7. Safety & Security
8. Cleanliness of Trail
9. Trail Surface
10. ADA Accessibilites
11. Connecting Paths to Restaurant/
Lodging
12. Connecting Paths to Bike
Shops & Services
13. Connecting Paths to Picnic
Areas & Snack Shops
Trail users rated recreational attributes within trail system in terms of importance and their opinion of its current condition. By asking for importance and condition, one is able to identify areas of concern to management. If a condition is rated as important and its Current condition was rated as poor, then it would likely be an area worthy of both attention and concern. The importance of trail conditions was computed for the entire pool of answers of responses. The current trail conditions were computed for not only the entire trail way system, but also for the various trail segments. Thus, this will enable one to compare the conditions of each of the trail segments in order to assess successes and identify areas of improvement at a more detailed level of study.
Figure 24 illustrates the users' perspectives on the importance of the above mentioned trail conditions. The importance of trail conditions have been arranged in decreasing order from "High" to "None" in levels of significance to the user.
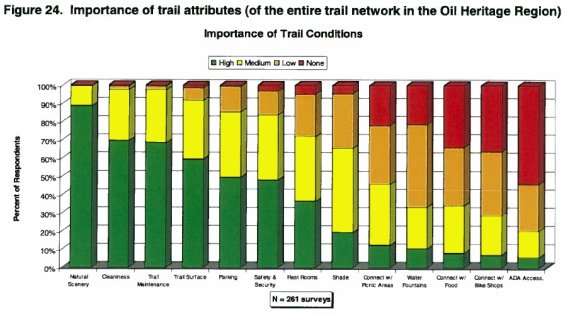
The quality of natural scenery, cleanliness, trail maintenance, and the trail surface were the most important recreational attributes. Whereas, the least important attributes were water fountains, connecting paths to restaurants/lodging, connecting paths to bike repair shops and services, and handicap accessible (ADA) trails. Thus, trail users are most interested in utilizing quality constructed trails, while enjoying the scenery of the area. They were not very concerned with accessing food places, lodging and shops.
Figure 25 illustrates the users' attitudes toward current conditions on the trail system. Current conditions were arranged in order from "Excellent" to "Non-Existent". The majority of trail users found most of the recreational attributes to be in either good or excellent condition. However, the following recreational attributes were cited as being rated as predominantly poor or non-existent along the trail system: ADA accessibility, connecting paths to bike repair shops and services, safety and security, and connecting paths to restaurants/lodging.

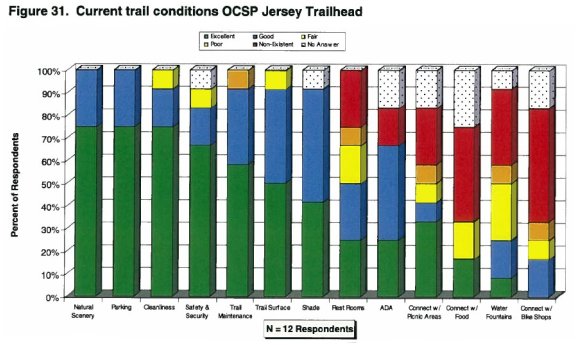
The following figures (Figure 26 - Figure 34) illustrate the responses of users' attitudes toward current trail conditions of each of the greenway segments that were surveyed in the study, with the exception of Two Mile Run County Park. (No questionnaire data was available for this site.) These surveys were categorized by the coded location at which the trail users retrieved their surveys.


The water trails were also surveyed on a limited basis throughout the duration of the trail utilization study. The following locations were selected to survey water trail users: Franklin boat launch, Oil City boat launches, Fishermen's Cove, and OCSP boat launches/fishing areas, Surveys were also mailed to water trail users who participated in a fishing tournament in fall 2006 (the address list was provided by the ORA). Figure 34 illustrates the collection of water trail users' perspectives of the recreational attributes current conditions. (All water trail survey locations were conglomerated due to the limited amount of survey data available.)

21. Would you be willing to give a donation to help maintain the trail?
•Yes
•No
Almost two-thirds of the survey respondents indicated that they would be willing to send a donation in order to maintain the trails. This is a significant number of users displaying economic interest in the future of the trail system. Several checks were sent along with completed questionnaires to the ORA.

22. We hope you had an enjoyable outing in the Oil Heritage Region trail system Please list other comments/suggestions to help us improve your next visit.
This question gave trail users the opportunity to add any additional significant information that they deemed necessary. Many trail users wrote praise of the trails, while also citing trail features that they hoped to see in the future. Below is a brief synopsis of areas where trail users comment on both the positive features and those areas that may require improvement:
Positive Trail/Regional Attributes:
Areas of Improvement:
Gaining input from local businesses in the service industry in the Oil Heritage Region is another key portion of data in order to assess the economic impacts of the trail. Thus, various business interviews throughout the region were conducted via telephone interviews or by transmitting a faxed/emailed sheet to the business to fill out and send back to the study team. Bed & Breakfasts (B&Bs), bicycle dealers, boating companies, canoe rentals, campgrounds, trail construction contractors, hotels/motels, orthopedic physicians, realtors and appraisers, and park and recreational departments were contacted.
Campgrounds (N=1)Trails that were noted to have impacts on the campgrounds were the ART, State Forest at Kennerdell, and OCSP Bike Trail. The traits draw in more out-of-state campers who are looking for trails. Also, increased revenues are produced, because trail users stay additional nights in the campgrounds. The campground business owner believes that the ORA and AVTA can benefit by working together to improve the economy of the area.
B&Bs (N=4)Trails that were noted to have impacts on the B&Bs were the ART, Justus Trail, Two Mile Run County Park Trail, Sandy Creek Trail, and the OCSP Bike Trail. As far as increases in patronage, the impacts range from none to some increased business. No one believed that the trails brought increases in property values to their, B&Bs. No problems with the trails or increases in use by local users were noted. Some B&Bs were involved with social events that occurred on the trails, but some believed there needed to be better publicity about the trails and B&Bs, so that they could better advertise themselves. One B&B noted 100% satisfaction with trail system.
Park and Recreation Departments (N=2)Trails that were noted to have impacts on the parks were the OCSP, Titusville (OCSP at Jersey Bridge), Justus Trail, ART, and Water Trails. The park managers indicated that many people know of the bike trails. At one location, the park manager believes its visitors come to utilize the bike trail. The trails bring more people to the area and to the park. Bike rentals, food, and beverages were the main revenue generators. Also, the trails enable users to become more exposed to the history of the area, and often draw more people into the Drake Well Museum. The parks indicated that they were partners with the URA and that with continued development of the trails, more money will be spent in the Oil Heritage Region.
Contractors (N=2)Trails that were noted to have impacts on die contractors were the ART, Two Mile Run County Park Trail, and the OCSP Bike Trail. They also noted some effects due to revenue, which was also due to an increased amount of local residents frequenting the trails. They have no problems with the trails and noted their overall satisfaction level as "good". The contractors did not indicate that they were members of the ORA or AVTA.
Contractors experience the most notable impacts when receiving bids to actually construct and design the trails. Contractors were hired by the AVTA, OCSP, and Two-Mile Run County Park in order to perform these jobs. Contractors could generate large incomes due to the vast amount of trails that have been constructed throughout the Oil Heritage Region. The AVTA alone has received over $6.5 million in grants and funds since 1991 in order to generate these trails. This money has supplied several contractors and engineering services with substantial contract awards throughout the duration of the trails' existence.
Real Estate Companies (N=3)Real estate companies are integral in trail studies to obtain information regarding increases in property values due to trails. Trails can affect property values and the general attractiveness of an area. Studies have shown that 70% of landowners felt that overall, an adjacent trail was a good neighbor, with positive impacts, such as getting in touch with nature, recreational opportunity, and health benefits. Furthermore, real estate agents often place an adjacent trail as a selling feature to a home. According to the article written by Gary Sjoquist, The Economic and Social Benefit of Trails, the majority of surveyed Minnesota homeowners (70%) believe that die property values are increased by recreational trails, or at the least that the trails have no impact on the prices. In addition, homes near Seattle's most popular trail sold for an average of 6% more than other property in the area.
Trails that were noted to have impacts on the real estate companies were the ART, Two Mile Run County Park Trail, and the Sandy Creek Trail. Some economic impacts were indicated, such as the trails bringing recreational buyers to the market, due to property values adjacent to the trails and waterways steadily going up. An increase in sale prices was especially noted along the ART due to a strong demand for river/trail front property. Real estate companies generally felt informed about upcoming social events with the trails and had no problems with the trails. Overall satisfaction of trails ranged from "Very supportive" to "Excellent". Some real estate companies were partners with the ORA, but not all indicated that they were.
The following literature references were utilized in order to compare the trail utilization study of the trail system within the Oil Heritage Region to other similar and recent studies. By comparing other studies to the Trail Utilization Study: Analysis of the Allegheny Valley Trail System within the Oil Heritage Region, one can begin to gauge the progress made by the trail system in this region, highlight its advantages, and locate areas of improvement.
1) 2002 User Survey for the Pennsylvania Trail Alliance - March 1, 2003
Prepared by: University of Pittsburgh - University Center for Social and Urban Research
Subject: Bike/Hike TrailThis study analyzed the use of the Allegheny Trail Alliance (ATA) system in western Pennsylvania from April 15 through November 15, 2002. A total of 5700 mail-in surveys were placed on vehicles at seven (7) different trailheads. Trail counters were also utilized in this study.
This study recorded a higher level of generated revenue with a total of $7,262,939. However, it was calculated over a longer period of time and was set in a more urban area with a greater advantage for more local residents to access the trails. Even though the revenues generated were much higher, the trail system within the Oil Heritage Region brought in higher per capita revenues in comparison with an average person spending of $8.84 per trip on the Pittsburgh area trails. The trail system within the Oil Heritage Region also had a greater amount of out-of state residents (22%) in comparison with die ATA study (10%). However, the average number of miles traveled to access the trails was greater (43.7 miles versus 33.25 miles) in this study than the Oil Heritage Region study.
2) PA Greenway Sojourn 2004 Participant Results-July 2004
Prepared by: Trail Facts - A Service of Interactive Marketing Solutions (Included in Sample Reports in PADCNR CD ROM)
Subject: Bike/Hike TrailThe PA Greenway Sojourn was held in Northwestern PA (including some of the Oil Heritage Region) in July of 2004. Approximately 387 sojourners participated in the event, embarking on either 3-day or 6-day journeys throughout the area. The event contributed over $159,000 to the economy, with meals totaling $38,000 of that sum and accommodations another $10,000. Due to the existence of the trail network within the Oil Heritage Region, an economic benefit resulted for the communities of this area.
Due to this large scale event, many bike enthusiasts frequented the trails from all over the country, resulting in differing types of users and economic impacts than what was noted in our 2006 study of die region. For example, less than half of the sojourners were Pennsylvania natives, in comparison to the 2006 study, which displayed that over threequarters of the trails users were from PA. The sojourn drew in users from multiple states in various regions (many out-of-state users were from either Ohio or New York in the 2006 study.) Word of mouth placed much less influence on the crowd attending the event (only 11% learned of the event via this method in comparison to 53% in the 2006 study). Most of the sojourners were rails-to-trails members. Thus, this organization was responsible for recruiting over 60% of the sojourners to the event (in comparison to 11% in our 2006 study).
There were also varying characteristics in user demographics. Over one-third of the sojourners had a household income of greater than $100,000 annually, whereas the 2006 study only had 16% of trail overnight guests earn greater than this amount. Many more users stayed in a hotel than a campground in this study (57% and 15.84%, respectively), in comparison to the 2006 study which had the greatest number of users stay in campgrounds (38%).
3) The Washington and Old Dominion Trail: An Assessment of User Demographics, Preferences, and Economics - December 9, 2004
Principal Investigators: USDA Forest Service
University of Georgia
Subject: Mixed Use Trail Study, including Bike /Foot/HorsebackA study was conducted from May 2003 through April 2004 on the Washington and Old Dominion Trail, which is a 100' wide, hard surfaced transportation and multi recreational corridor in Northern Virginia. The study recorded 1,707,353 adult visits, with only 5.24% of those visitors being from outside the Virginia area (22% of trail users were outof-staters in our study). The two largest age cohorts were 36-45 and 46-55, which was consistent with our study. The average group size was 1.57, and most frequented the trails alone (average group size was 2.78 and most frequented the trails with another user in die Oil Heritage Region study). An average trip to these trails was worth between $9 and $14 per visitor, in comparison with the S3.71 to $32.93 range per visitor in our study.
Biking and walking were the most common fitness activities on these trails, which was similar to our study. However, 54% of trail users ranked the trails as a place to train for fitness events, which was rated much lower in the trail system within the Oil Heritage Region (3%). Season ratings also differed in that their trails were ranked: summer, spring, fall, winter. Fall was our most abundant trail use season, followed by summer. Natural scenery and trail maintenance ranked as #1 and #2 in importance and condition, which was relatively similar to our study. Health and recreation were important factors for using the trails in both studies. And, some equestrian use was also noted on these trails, as well as on the trail system within the Oil Heritage Region.
4) Heritage Rail Trail County Park 2001 User Survey and Economic Impact Analysis - June 2002
Prepared by; Trail Facts - A Service of Interactive Marketing Solutions (Included in Sample Reports in PA DCNR CD ROM)
Subject: Bike/Hike TrailThe Heritage Rail Trail extends 21 miles in length from the Mason Dixon line (on the Pennsylvania-Maryland border) to York, Pennsylvania. It is a relatively new trail and was established in the late 1990's. A user survey and economic analysis was conducted for the trail in 2001 and 2002, with a total of 320 forms to analyze.
Since the trail is located in southeastern PA, most trail users were from that area. Almost two-thirds of users were from York County, while approximately 90% of users were PA residents in the southeastern sector of the state. The other 10% of users were from the Maryland-Virginia-DC area. (Our trail study consisted of 22% out-of-state users and only 23% of in-state users residing within the Oil Heritage Region.)
The usage patterns differed from those that were uncovered in this study. More than 45% of the users indicated that they frequented the trails at least once per week, in comparison with most utilizing the trail system within the Oil Heritage Region a few times per year (50%). However, smaller percentages of trail users were on the trails at least two hours in this study, with over one-third of the participants visiting the trails for one to two hours. (Oil Heritage trails recorded two-thirds of the survey group utilizing the trails for over two hours.) Morning was also the most popular tune to utilize die trails, which differed from the afternoon and evening use that was often common on our trails. Also weekend and weekday usage was split in the York trails, in comparison to the Oil Heritage trails being accessed most heavily on the weekends (23% used the trails on weekdays only).
However, recreational activities were quite similar between the trails with biking and then walking/hiking being the most popular user activities. Also, most trail users discovered the trails via "word of mouth" in each of the studies. Maintenance and cleanliness were also cited as "excellent" in regards to trail attributes in both studies. Trail users were much more satisfied with safety and security (90% in York compared to just under 50% in Oil Heritage Region).
5) The Virginia Creeper Trail: An Assessment of User Demographics, Preferences, and Economics - December 8, 2004
Principal Investigators: USDA Forest Service
University of Georgia
Subject.- Mixed Use Trail Study, including Bike/Foot/HorsebackThe Virginia Creeper Trail (VCT) is a rail trail in the southwestern portion of the state and extends 34 miles in length. An assessment of trail users and economic impacts was, performed between November 2002 and October 2003. The survey was categorized into summer and winter sampling, in which over eighty sampling days of data were retrieved.
User demographics between the trails were relatively similar, with the VCT registering slightly younger users (50% of users were between the ages of 36-55 and 18% of users were between die ages of 56-65+). Users also had slightly higher income levels, with the average income being $72,315, and where 54% earned anywhere from S40,000 to $120,000 annually.
Both trails recorded 72% of the trail users citing the trails as the primary purpose of their visit to the area; and biking and walking were the most popular trail activities. Another 15% of trail users on the VCT partook in activities such as jogging, camping, viewing nature, horseback riding, and fishing, which roughly corresponds with the data in our study. Also, the two most highly rated benefits of the trail were health and fitness and viewing nature, which were also indicated in our study of the trail system within the Oil Heritage Region.
Regarding expenditures, it was estimated that approximately $2.5 million dollars was spent over the sampling period with approximately $23-38 of economic benefit to the area per person per trip. Our estimated trail spending was larger over the year ($4.31 million), and had approximately the same economic benefit per person per trip.
6) The Waterway at New River State Park- An Assessment of User Demographics, Preferences, and Economics - December 9, 2004
Principal Investigators: USDA Forest Service
University of Georgia
Subject.- Water TrailThis study was performed on the Waterway at New River State Park in Virginia. Two surveys were utilized, one for local residents and one for non-local residents. Trail users were approached and were asked if they wished to participate in a survey, rather than placing surveys for trail users to pick up at trailheads.
The primary activity of these trails was fishing (43%), while other common activities were canoeing, kayaking, boating, and tubing. Some recreational activities, such as biking, were noted. However, this study primarily focused on water trail users.
This study was quite different than our predominantly greenway trail study and had many different user characteristics. Trail users were younger and had higher household incomes than those noted in our surveys. Trail users also traveled longer distances to the trails (average distance traveled was 117 miles). Users were more concerned with issues such as avoiding Conflict along the trails, safety, and public access. Parking, avoiding conflict, and public access were indicated as the best assets to the trails. The top recreational features of the trails were the following: water quality, water quantity, outdoor attractions, outdoor equipment, and canoe-in camping. The amount of money spent on the trails due to water based recreation was also greater than in our study. This study averaged $136 per group, while our study averaged from $10.91 to $88.49 per group.
Comparing and contrasting other studies to the results of the Trail Utilization Study: Analysis of' the Allegheny Valley Trail System within the Oil Heritage Region provided an opportunity to verify the economic impacts on the regional economy. In just four months, the trails attracted almost 83,000 trails users and generated over $2.22 million in revenues. Over a year, these impacts totaled approximately 161,000 trail users and $4.31 million in generated income for the Oil Heritage Region.
However, the value of the trails extends beyond the direct economic impact. These trails were all cited as being used for both health and recreational benefits. Many people who live in these areas are proud of their trail systems and enjoy accessing them to go biking or go for a scenic bike ride, along with many other activities. The trails serve as a conduit for both local and nonlocal users to access the environment of the region.
The trails also serve as an alluring advertising feature for the tourism industry of the area. The Oil Heritage Region is full of history, culture, and scenery. An area that was once just a memory of the oil boom days in Pennsylvania is now transforming itself into an attractive tourist attraction for people from all over the country to visit. The railroad corridors, once so important to the local, regional and national economy, now continue to play an important role in connecting communities of the Oil Heritage Region. They enable users to traverse the area on foot or bike and explore the scenic and historic landmarks. They even connect to train stations, where trail users can "climb aboard" and ride to museums and further explore history of the region. The trail system within the Oil Heritage Region is a proven resource that enhances the region's ability to continue to grow toward a more sustainable future.


1. What is your residence Zip Code? __________
2. How many people, including yourself, are in your group? ______people
2a. Are any children under the age of 15 with you on your trail experience today?
Yes______ No______
2b. If YES, how many are: "under age 10"______ or "ages 10-14"_____ ?
3. Did you stay last night adjacent to the trail system? Yes______ No______
If NO, how far did you travel to get to where you entered the trail today? __________miles
4. What is your primary activity on the trail? (Circle all that apply.) Walking/Hiking Biking
Jogging XC Skiing/Snowshoeing Rollerblading Horseback Riding Backpacking
5. During your trail visit did you: (Circle all that apply.) Hunt Fish Canoe Kayak
Camp Watch Birds Watch Wildlife Study Flowers Enjoy the Scenery Have a Picnic
6. Would you consider your use of the trail to be for: (Circle one response.)
Recreation Health/Exercise Commuting Fitness Training (marathon, triathlon)
Other (specify) ___________
7. How often, on average, do you use this trail system?
| ___First Time | ___Once a Month | ___Once a Week | ___3-5 Times/Week | |
| ___A Few Times a Year | ___A Few Times a Month | ___2 Times/Week | ___Daily |
8. Rank your trail usage by season from 1 to 4 (1=most, 4=least):
____ Summer ____ Fall ____ Winter ____ Spring
9. Generally, when do you use the trail? (Circle one response.) Weekdays Weekends Both
10. How much time do you generally spend on the trail each visit? (Circle one response.)
Less than 30 minutes 30 minutes to 1 hour 1 to 2 hours More than 2 hours
11. How did you find out about the trail? (Circle all that apply.)
Word of Mouth Roadside Signage Driving Past Newspaper PADCNR Bike Shop
Information from RTC Visitors Bureau
Internet Website (specify organization)_____________________ Other______________
12. Is the trail system a main reason for this trip to the Oil Heritage Region? Yes______ No______
13. Is your visit to the Oil Heritage Region an overnight trip away from home? Yes______ No______
If YES:
13a. How many nights will you be staying in the Oil Heritage Region? _______nights
13b. What type of accommodation is your group staying in for the duration of your visit in the Oil
Heritage Region?
___Motel/Hotel ___Bed & Breakfast ___Friend or Relative’s Home ___Campground
___Other________
14. What was/will be the total spending of your whole group in the Oil Heritage Region during your visit
(or during your most recent visit) for the following categories?
| Lodging: | $________ | Recreation Related: | ||
| Food & Beverage: | Bike Rental | $________ | ||
| Foods/drinks consumed at restaurants or bars | $________ | Biking Equipment | $________ | |
| Snack foods/groceries/ice cream/carry-out | $________ | Boat Rental | $________ | |
| Transportation: | Any Other Expense: | |||
| Gasoline, oil, repairs | $________ | Footwear, Clothing, Film, Etc. | $________ | |
| Other (airfare, vehicle rental) | $________ |
15. What is your age?
A. 15-25 C. 26-35 D. 36-45 E. 46-55 F. 56-65 G. Over 65
16. What is your gender? A. Female B. Male
17. What is your employment status?
A. Student B. Employed – Professional C. Employed – Skilled Laborer D. Retired
E. Not currently working
18. What is your annual pre-tax household income?
A. Under $40,000 B. $40 – 59,999 C. $60 – 79,999 D. $80 – 99,999 E. $100 – 119,999
F. $120 – 139,999 G. $140 – 159,999 H. $160 – 179,999 I. $180 – 199,999
J. $200,000 and over
19. Which trail(s) do you use throughout the year in the Oil Heritage Region? (Check all that apply.)
___Allegheny River ___Justus ___Two-Mile Run ___Sandy Creek
___ State Forest at Kennerdell ___Oil Creek State Park ___Water Trail
___Other (specify) ______________________
20.Please rate the following in terms of importance to you and then current conditions (only if they apply).
| Importance to you | Condition Today | |||||||||
| Recreation Attributes | High | Med | Low | None | Excel | Good | Fair | Poor | Non- Existent |
|
| 1. Parking | ||||||||||
| 2. Natural Scenery | ||||||||||
| 3. Amount of Shade | ||||||||||
| 4. Restrooms | ||||||||||
| 5. Trail Maintenance | ||||||||||
| 6. Water Fountains | ||||||||||
| 7. Safety & Security | ||||||||||
| 8. Cleanliness of Trail | ||||||||||
| 9. Trail Surface | ||||||||||
| 10. ADA Accessibilites | ||||||||||
| 11. Connecting Paths to Restaurant/ Lodging |
||||||||||
| 12. Connecting Paths to Bike Shops & Services |
||||||||||
| 13. Connecting Paths to Picnic Areas & Snack Shops |
||||||||||
21. Would you be willing to give a donation to help maintain the trail? Yes_____ No_____
22. We hope you had an enjoyable outing in the Oil Heritage Region trail system. Please list other
comments/suggestions to help us improve your next visit:
23. Optional: Name:_______________________________
Mailing Address:_______________________________
Please send me information about:_______________________________
Dear Management Personnel:
The Oil Region Alliance (ORA) and the Allegheny Valley Trails Association (ATVA), along with die aid of a private consultant, PBS&J, are working together to perform, a use and impact study of the Oil Heritage Region recreational trail system. The purpose of this study is to provide both a quantitative and qualitative analysis of trail use, so that the economic impact of the trails in the region may be assessed. The types of trail users, number of trail users, and the many trailheads are being studied in the Oil Region area in order to obtain the proper knowledge for the study.
Gaining information from our local businesses in the service industry is another key portion of data to assess in the economic impacts of the trails, as well. Therefore, the Oil Heritage Region Recreational Trail Study Team is providing the businesses in the region with a survey questionnaire. These surveys were generated specifically for business owners to share their input on how the trail may or may nor aid in bringing in additional business and consumers to their enterprise.
Out Study Team has been tediously collecting data via surveys made available to trail users, but the success of the survey results also relies on gathering information from the service industry in the area. This survey is being sent out to bed and breakfasts, recreational suppliers, trail contractors, gift shops, hotels and motels, employment agencies, and many other key service sectors in the area. Receiving input from your business is integral to the success of our study. By contributing your thoughts and meaningful responses to the questionnaire provided, you will enable our study team to more effectively plan for the growth and success of the future of the Oil Heritage Region. Please enter your comments onto the questionnaire and send them back to our study team as soon as you can, because we arc nearing the end of project study time!
Thank you in advance,
Oil Heritage Region Recreational Trail Study Team Study Team Contacts:
Jackie Sorg - PBS& J
400 Technology logy Drive, Suite 100
Canonsburg, PA 15317
Phone: 724.514.9000x107
Fax: 724.514.9090
Email: JRSorg@pbsj.com
Kim Harris - ORA
P.O. Box 123
206 Seneca Street, 4th Floor
Oil City, PA 16301
814-677-3152, Extension 120
Email: kharris@oilregion.org
NOTE: This trail use study was financed in pan by a Pennsylvania Heritage Areas Program Grant from the PA Department of Conservation and Natural Resources, Bureau of Recreation and Conservation, via the Oil Region Alliance of Business, Industry & Tourism. Matching funds were provided courtesy of the Allegheny Valley Trails Association.
1. What type of business do you manage or own?
2. Which trails have impact on your facility?
| a. Allegheny River | e. State Forest at Kennerdell | |
| b. Justus | f. Oil Creek State Park | |
| c. Two Mile | g. Water Trail | |
| d. Sandy Creek | h. Other |
3. Generally, how do you think the trail(s) has/have affected your patronage?
4. Generally, how do you think the trail(s) has/have affected your property values?
5. Generally, how do you think the trail(s) has/have affected your business revenues?
a. Do trail users have a notable impact on your revenues?
b. Do the trails aid in more local residents utilizing your business,
thus increasing revenues?
6. Have you experienced any problems that you attribute to the trail?
7. Is your business informed of upcoming social events on the trail(s)?
a. Does your business get involved with these social events?
b. Does your business use these events to better advertise itself?
8. How supportive were you of the trail system before it opened?
9. What is your overall satisfaction of the trail system?
10. Is your business affiliated with (or a business partner with) the
Allegheny Valley Trails Association
(AVTA) or the Oil Region Alliance (ORA)?
a. If not, would you like to be?
11. Do you feel that by continuing to expand the trails, the ORA and AVTA
can benefit by working together
to improve the economy of the Oil Heritage Region?
12. Do you have any additional comments to add?
| 2006 Oil Heritage Region Trail System - User Tally Sheet | ||
| Submitted by: | ||
| Name of Trail: | ______________________________________________ | |
| Trail Segment: | ______________________________________________ | |
| Date: | ______________________________________________ | |
| Time (circle): | AM PM | |
| TRAIL USER | TOTAL | |
| Bikers | ||
| Runners | ||
| Walkers | ||
| In-line Skaters | ||
| Wheel Chair Riders | ||
| Other |
| Thank you for helping the Allegheny Valley Trails Association!!! |